Excelling in Excel
By Natalie Streiner
In order to construct a graph of a function y=f(x) I simply followed a few basic steps.
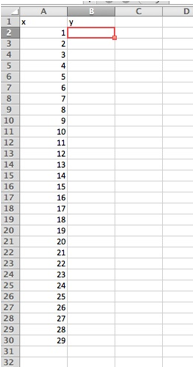
I first input x in cell A1 and y in cell B2.
From there I input my x values.
I chose 1 to 29 as my domain.
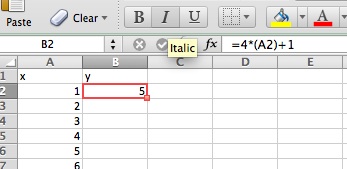
From there, I then used the f(x)
bar to input my function.
I chose to graph the function y=4x+1.
Note that rather than typing “4x+1” in the f(x), A2 must be used for x as shown below.
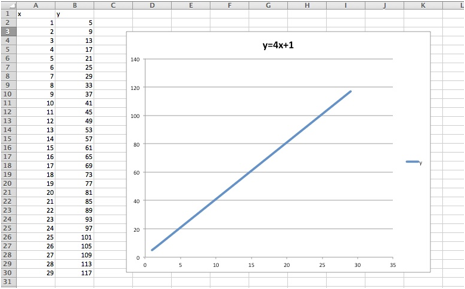
Next, I highlighted the B2 to B30, so the function
would be applied to those x values.

Then, I highlighted all the data, then
clicked InsertàChartàScatteràSmooth Lined Function.
Here is the resulting graph of y=4x+1
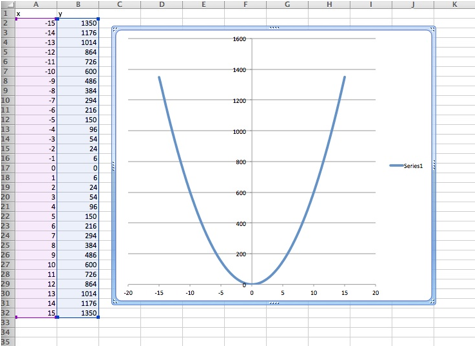
I then followed these same steps in order to graph
y=6x2